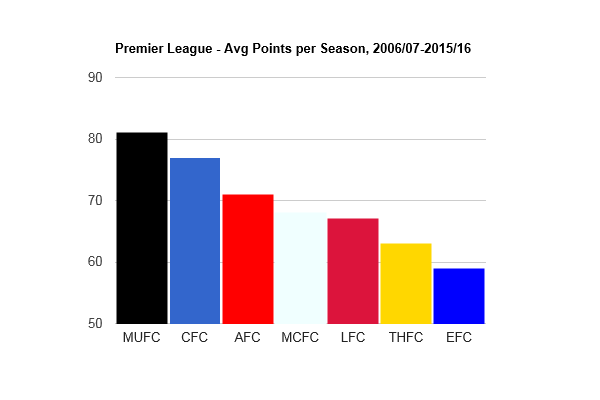
By now readers are familiar with my research on the importance of winning streaks as a predictor of Arsenal winning the league (read my first and second blog on the subject). So after last weekend the streak now stands at 6-wins and the league table now reads:
| Position | 2nd |
| Games played | 8 |
| Wins | 6 |
| Loss | 1 |
| Draws | 1 |
| Points | 19 |
| Points Per Game | 2.38 |
So despite the hysteria and portents of doom by the emotionally driven majority in the fanbase, after a slow start the club has rapidly made up ground on a now stumbling Manchester City and is only second place in the league by dint of goal difference.
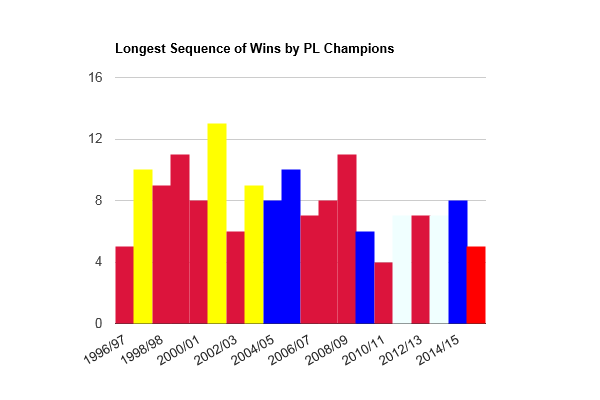
Historically Arsenal have won the title by streaking; 13 games in 2001/02, 10 games in 1997/98 and 9 games in 2003/04. Should the current winning streak continue, I concluded it would be a massive indicator of a serious title challenge. Currently the data is not conclusive and I would urge fans to not pop any champagne bottles, at least not just yet.
Why my caution? Because history shows, since last winning a title in 2003/04, the club has had a habit of starting very well and fading down the homestretch. This is evident in the data for Points Per Games (ppg) mid-season and full-season:
| Mid Season | Full Season | |
| 2004-05 | 2.16 | 2.18 |
| 2005-06 | 1.74 | 1.76 |
| 2006-07 | 2.06 | 2.04 |
| 2007-08 | 2.35 | 2.18 |
| 2008-09 | 1.75 | 1.89 |
| 2009-10 | 2.16 | 1.97 |
| 2010-11 | 1.89 | 1.79 |
| 2011-12 | 1.89 | 1.84 |
| 2012-13 | 1.74 | 1.92 |
| 2013-14 | 2.21 | 2.08 |
| 2014-15 | 1.74 | 1.97 |
| 2015-16 | 2.05 | 1.87 |
| Average | 1.98 | 1.96 |
In raw numbers it may seem to be a mere 2 basis points difference but proportionately it is a 10% negative swing. Mathematically that is significant reversal; from an average of 38 points in the first half of the season to 36 points in the second, gives a season average total of 74 points. Over the same period the winning team in the EPL averaged 2.30 ppg or a season total of 87 points, a whopping 13 point superiority over Arsenal.
Despite years of wilful misinformation by the mainstream media and so-called Arsenal bloggers, in their desire to have Arsene Wenger sacked, the primary reason why the club faded over the stretch was not having sufficient resources to build a squad of with the requisite quality and depth, given the priority of having to pay for a new stadium. I have spent several blogs doing the pre-Emirates vs post-Emirates comparison to show Wenger was both a genius for winning titles at Highbury as well keeping Arsenal competitive post-Emirates despite being massively outspent by his main rivals. The data is unchallenged and bears no repeating.
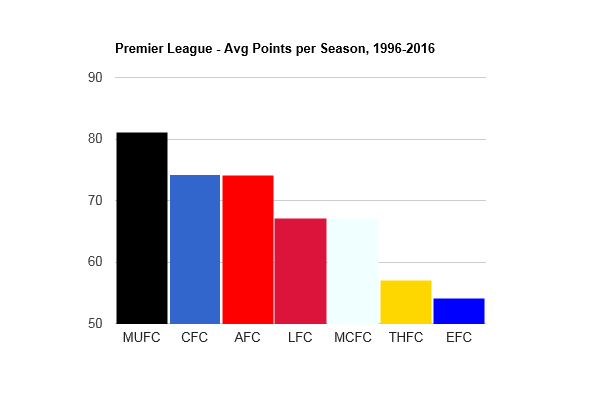
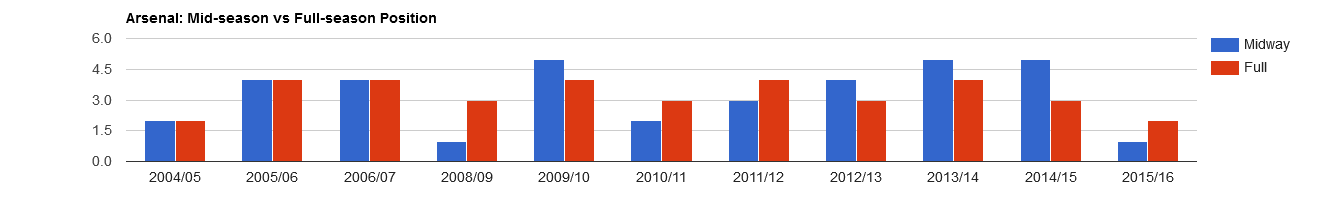
But despite the spending handicap over the past 12 years, the club has occasionally out-competed the entire league at the start of season; sitting at the top midway but eventually fading. However final league position has progressively improved over the last three years, from 4th in 12/13 to 2nd in 15/16. The graph below illustrates.
Average Points Per Game (PPG)
But the number I found to be significant, streak or no-streak, is the average ppg. After 8 games AFC is literally steaming at 2.38 ppg. Continue at this rate and the club will approach averages last seen in the Invincible year, which was a steady 2.37 ppg both midway and full season. Since those heady days, the next best was the average 2.35 ppg midway 2007-08, the year when our title challenge was literally smashed with the multiple fracture of Eduardo’s leg at Birmingham City in March 2008.
Average PPG – Premier League Champions
| Mid Season | Full Season | |
| 2004-05 | 2.42 | 2.50 |
| 2005-06 | 2.75 | 2.38 |
| 2006-07 | 2.47 | 2.34 |
| 2007-08 | 2.18 | 2.26 |
| 2008-09 | 2.25 | 2.37 |
| 2009-10 | 2.25 | 2.26 |
| 2010-11 | 2.11 | 2.11 |
| 2011-12 | 2.37 | 2.34 |
| 2012-13 | 2.45 | 2.34 |
| 2013-14 | 2.16 | 2.25 |
| 2014-15 | 2.42 | 2.29 |
| 2015-16 | 2.05 | 2.13 |
| Average | 2.32 | 2.30 |
As the table above illustrates, since 2004 the average winner of the PL title has averaged 2.32 and 2.30 ppg midway and full-season respectively. Interestingly the most dominant mid season performance was Chelsea’s in 2005-06, a year they suffered only one loss, coming very close to matching the Invincibles. The least dominant mid-season performance was last year’s, by Leicester, at 2.05 ppg. They were however able to improve their average point-haul by 39% in the second half of the season. In contrast over the 12 year period, most clubs set out to dominate in the first half of the season and suffer some tailing off in the 2nd. This happened 7 out of 12 times. But surely anything above the mid-season 2.32 ppg average is statistically significant.
In my opinion it is too early to come to any conclusions about the current streak. We are just half way into the first half of the season with ten more games to go. Clearly some patterns are beginning to show which we can all track and measure. I leave it to you dear readers to speculate.